


OpenTelemetry Collector位於OpenTelemetry架構的核心,但與W3C Trace Context無關。在我的追蹤示範中,我使用Jaeger而非Collector。然而,它在每篇OpenTelemetry相關文章中都無處不在。我想要進一步探索它。
在本文中,我將探討Collector的各個面向:
- 數據種類:日誌、指標與追蹤
- 推送與拉取模型
- 操作:讀取、轉換與寫入
第一步
A long time ago, observability as we know it didn’t exist; what we had instead was monitoring. Back then, monitoring was a bunch of people looking at screens displaying dashboards. Dashboards themselves consisted of metrics and only system metrics, mainly CPU, memory, and disk usage. For this reason, we will start with metrics.
Prometheus是主要的監控解決方案之一。它採用拉取式模型:Prometheus從應用程式的相容端點抓取數據並內部儲存。
我們將使用OTEL Collector來抓取與Prometheus相容的端點,並在控制台輸出結果。Grafana Labs提供了一個專案來生成隨機指標以供實驗。為簡化起見,我將使用Docker Compose;設置如下:
version: "3"

services:
  fake-metrics:
    build: ./fake-metrics-generator                                         #1
  collector:
    image: otel/opentelemetry-collector:0.87.0                              #2
    environment:                                                            #3
      - METRICS_HOST=fake-metrics
      - METRICS_PORT=5000
    volumes:
- ./config/collector/config.yml:/etc/otelcol/config.yaml:ro #4- 該假指標專案沒有可用的Docker映像,因此我們需要自行構建
- 撰寫本文時的最新版OTEL Collector
- 參數化以下配置文件
- 一切在此發生
如前所述,OTEL Collector功能強大,因此配置至關重要。
receivers:                                                                  #1
  prometheus:                                                               #2
    config:
      scrape_configs:                                                       #3
        - job_name: fake-metrics                                            #4
          scrape_interval: 3s
          static_configs:
            - targets: [ "${env.METRICS_HOST}:${env.METRICS_PORT}" ]

exporters:                                                                  #5
  logging:                                                                  #6
    loglevel: debug

service:
  pipelines:                                                                #7
    metrics:                                                                #8
      receivers: [ "prometheus" ]                                           #9
exporters: [ "logging" ] #10- 接收器列表。接收器讀取數據;它可以是推送式或拉取式。
- 我們使用
prometheus預定義接收器 - 定義拉取任務
- 任務配置
- 導出器列表。與接收器相反,導出器寫入數據。
- 最簡單的導出器是將數據寫入標準輸出
- 管道組合接收器和導出器
- 定義與指標相關的管道
- 該管道從先前定義的
prometheus接收器獲取數據並將其發送到logging導出器,即,打印它們
這裡是一個結果樣本:
2023-11-11 08:28:54 otel-collector-collector-1     | StartTimestamp: 1970-01-01 00:00:00 +0000 UTC
2023-11-11 08:28:54 otel-collector-collector-1     | Timestamp: 2023-11-11 07:28:54.14 +0000 UTC
2023-11-11 08:28:54 otel-collector-collector-1     | Value: 83.090000
2023-11-11 08:28:54 otel-collector-collector-1     | NumberDataPoints #1
2023-11-11 08:28:54 otel-collector-collector-1     | Data point attributes:
2023-11-11 08:28:54 otel-collector-collector-1     |      -> fake__embrace_world_class_systems: Str(concept)
2023-11-11 08:28:54 otel-collector-collector-1     |      -> fake__exploit_magnetic_applications: Str(concept)
2023-11-11 08:28:54 otel-collector-collector-1     |      -> fake__facilitate_wireless_architectures: Str(extranet)
2023-11-11 08:28:54 otel-collector-collector-1     |      -> fake__grow_magnetic_communities: Str(challenge)
2023-11-11 08:28:54 otel-collector-collector-1     |      -> fake__reinvent_revolutionary_applications: Str(support)
2023-11-11 08:28:54 otel-collector-collector-1     |      -> fake__strategize_strategic_initiatives: Str(internet_solution)
2023-11-11 08:28:54 otel-collector-collector-1     |      -> fake__target_customized_eyeballs: Str(concept)
2023-11-11 08:28:54 otel-collector-collector-1     |      -> fake__transform_turn_key_technologies: Str(framework)
2023-11-11 08:28:54 otel-collector-collector-1     |      -> fake__whiteboard_innovative_partnerships: Str(matrices)
2023-11-11 08:28:54 otel-collector-collector-1     | StartTimestamp: 1970-01-01 00:00:00 +0000 UTC
2023-11-11 08:28:54 otel-collector-collector-1     | Timestamp: 2023-11-11 07:28:54.14 +0000 UTC
2023-11-11 08:28:54 otel-collector-collector-1     | Value: 53.090000
2023-11-11 08:28:54 otel-collector-collector-1     | NumberDataPoints #2
2023-11-11 08:28:54 otel-collector-collector-1     | Data point attributes:
2023-11-11 08:28:54 otel-collector-collector-1     |      -> fake__expedite_distributed_partnerships: Str(approach)
2023-11-11 08:28:54 otel-collector-collector-1     |      -> fake__facilitate_wireless_architectures: Str(graphical_user_interface)
2023-11-11 08:28:54 otel-collector-collector-1     |      -> fake__grow_magnetic_communities: Str(policy)
2023-11-11 08:28:54 otel-collector-collector-1     |      -> fake__reinvent_revolutionary_applications: Str(algorithm)
2023-11-11 08:28:54 otel-collector-collector-1     |      -> fake__transform_turn_key_technologies: Str(framework)
2023-11-11 08:28:54 otel-collector-collector-1     | StartTimestamp: 1970-01-01 00:00:00 +0000 UTC
2023-11-11 08:28:54 otel-collector-collector-1     | Timestamp: 2023-11-11 07:28:54.14 +0000 UTC
2023-11-11 08:28:54 otel-collector-collector-1     | Value: 16.440000
2023-11-11 08:28:54 otel-collector-collector-1     | NumberDataPoints #3
2023-11-11 08:28:54 otel-collector-collector-1     | Data point attributes:
2023-11-11 08:28:54 otel-collector-collector-1     |      -> fake__exploit_magnetic_applications: Str(concept)
2023-11-11 08:28:54 otel-collector-collector-1     |      -> fake__grow_magnetic_communities: Str(graphical_user_interface)
2023-11-11 08:28:54 otel-collector-collector-1     |      -> fake__target_customized_eyeballs: Str(extranet)
超越打印
上述是一個很好的第一步,但除了控制台打印之外還有更多。我們將暴露指標以便由常規Prometheus實例抓取;我們可以添加一個Grafana儀表板來視覺化它們。儘管這可能看起來無意義,但請耐心,因為這只是一個墊腳石。
為實現上述目標,我們只需更改OTEL收集器的配置:
exporters:
  prometheus:                                                               #1
    endpoint: ":${env:PROMETHEUS_PORT}"                                     #2

service:
  pipelines:
    metrics:
      receivers: [ "prometheus" ]
exporters: [ "prometheus" ] #3- 添加一個
prometheus導出器 - 公開符合Prometheus的端點
- 用暴露替換打印
就是這樣。OTEL收集器非常靈活。
請注意,收集器是多輸入、多輸出的。為了同時打印數據並通過端點暴露它們,我們將它們添加到管道中:
exporters:
  prometheus:                                                               #1
    endpoint: ":${env:PROMETHEUS_PORT}"
  logging:                                                                  #2
    loglevel: debug

service:
  pipelines:
    metrics:
      receivers: [ "prometheus" ]
exporters: [ "prometheus", "logging" ] #3- 暴露數據
- 打印數據
- 此管線將同時列印數據並對外公開
配置Prometheus exporter後,我們可以在Grafana中視覺化指標。
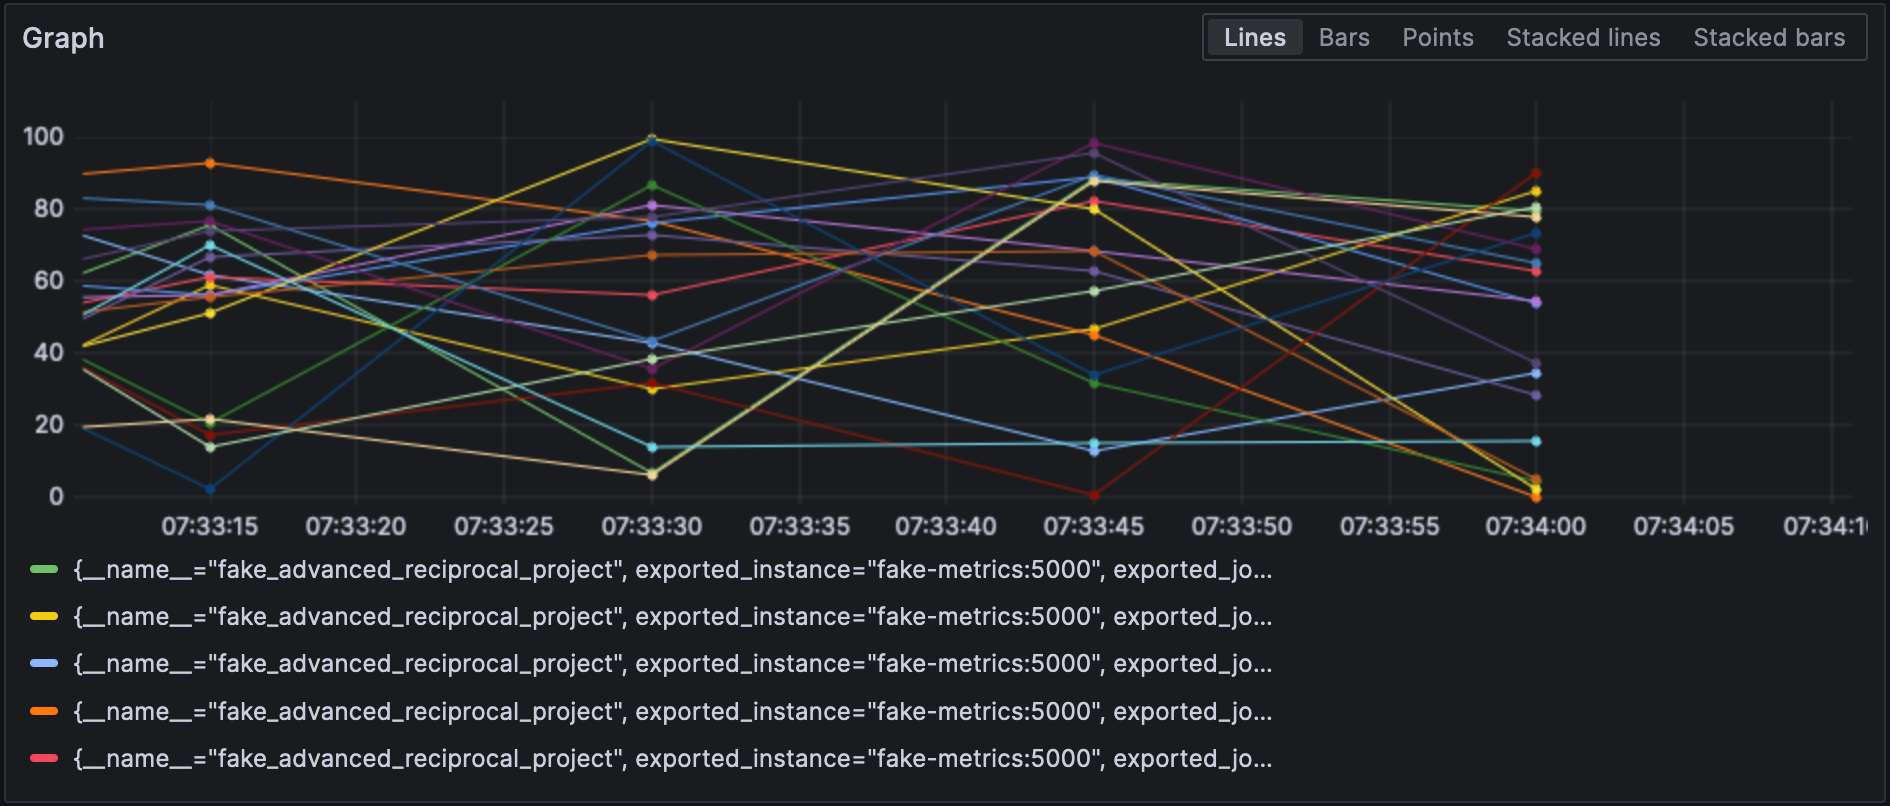
注意,接收器和出口器需指定其類型且每個類型必須唯一。為符合此要求,我們可以附加一個限定詞以區分它們,例如,prometheus/foo和prometheus/bar.
中間數據處理
A valid question would be why the OTEL Collector is set between the source and Prometheus, as it makes the overall design more fragile. At this stage, we can leverage the true power of the OTEL Collector: data processing. So far, we have ingested raw metrics, but the source format may not be adapted to how we want to visualize data. For example, in our setup, metrics come from our fake generator, “business,” and the underlying NodeJS platform, “technical.” It is reflected in the metrics’ name. We could add a dedicated source label and remove the unnecessary prefix to filter more efficiently.
您在配置文件的processors部分宣告數據處理器。收集器按照宣告的順序執行它們。讓我們實現上述轉換。
朝目標邁出的第一步是理解收集器有兩種版本:一種是“裸”版本,另一種是基於其上的contrib版本。前者包含的處理器數量和功能都有限;因此,我們需要切換到contrib版本。
collector:
  image: otel/opentelemetry-collector-contrib:0.87.0                        #1
  environment:
    - METRICS_HOST=fake-metrics
    - METRICS_PORT=5000
    - PROMETHEUS_PORT=8889
  volumes:
- ./config/collector/config.yml:/etc/otelcol-contrib/config.yaml:ro #2- 使用
contrib風味 - 更有趣的是,配置文件位於另一路徑
此時,我們可以添加處理器本身:
processors:
  metricstransform:                                                         #1
    transforms:                                                             #2
      - include: ^fake_(.*)$                                                #3
        match_type: regexp                                                  #3
        action: update
        operations:                                                         #4
          - action: add_label                                               #5
            new_label: origin
            new_value: fake
      - include: ^fake_(.*)$
        match_type: regexp
        action: update                                                      #6
        new_name: $${1}                                                     #6-7
# 對NodeJS生成的指標也進行相同操作- 調用指標轉換處理器
- 按順序應用的轉換列表
- 匹配所有定義正則表達式的指標
- 按順序應用的操作列表
- 添加標籤
- 通過移除正則表達式組前綴來重命名指標
- 有趣的是:語法是
$${x}
最後,我們將定義的處理器添加到管線中:
service:
pipelines:
metrics:
receivers: [ "prometheus" ]
processors: [ "metricstransform" ]
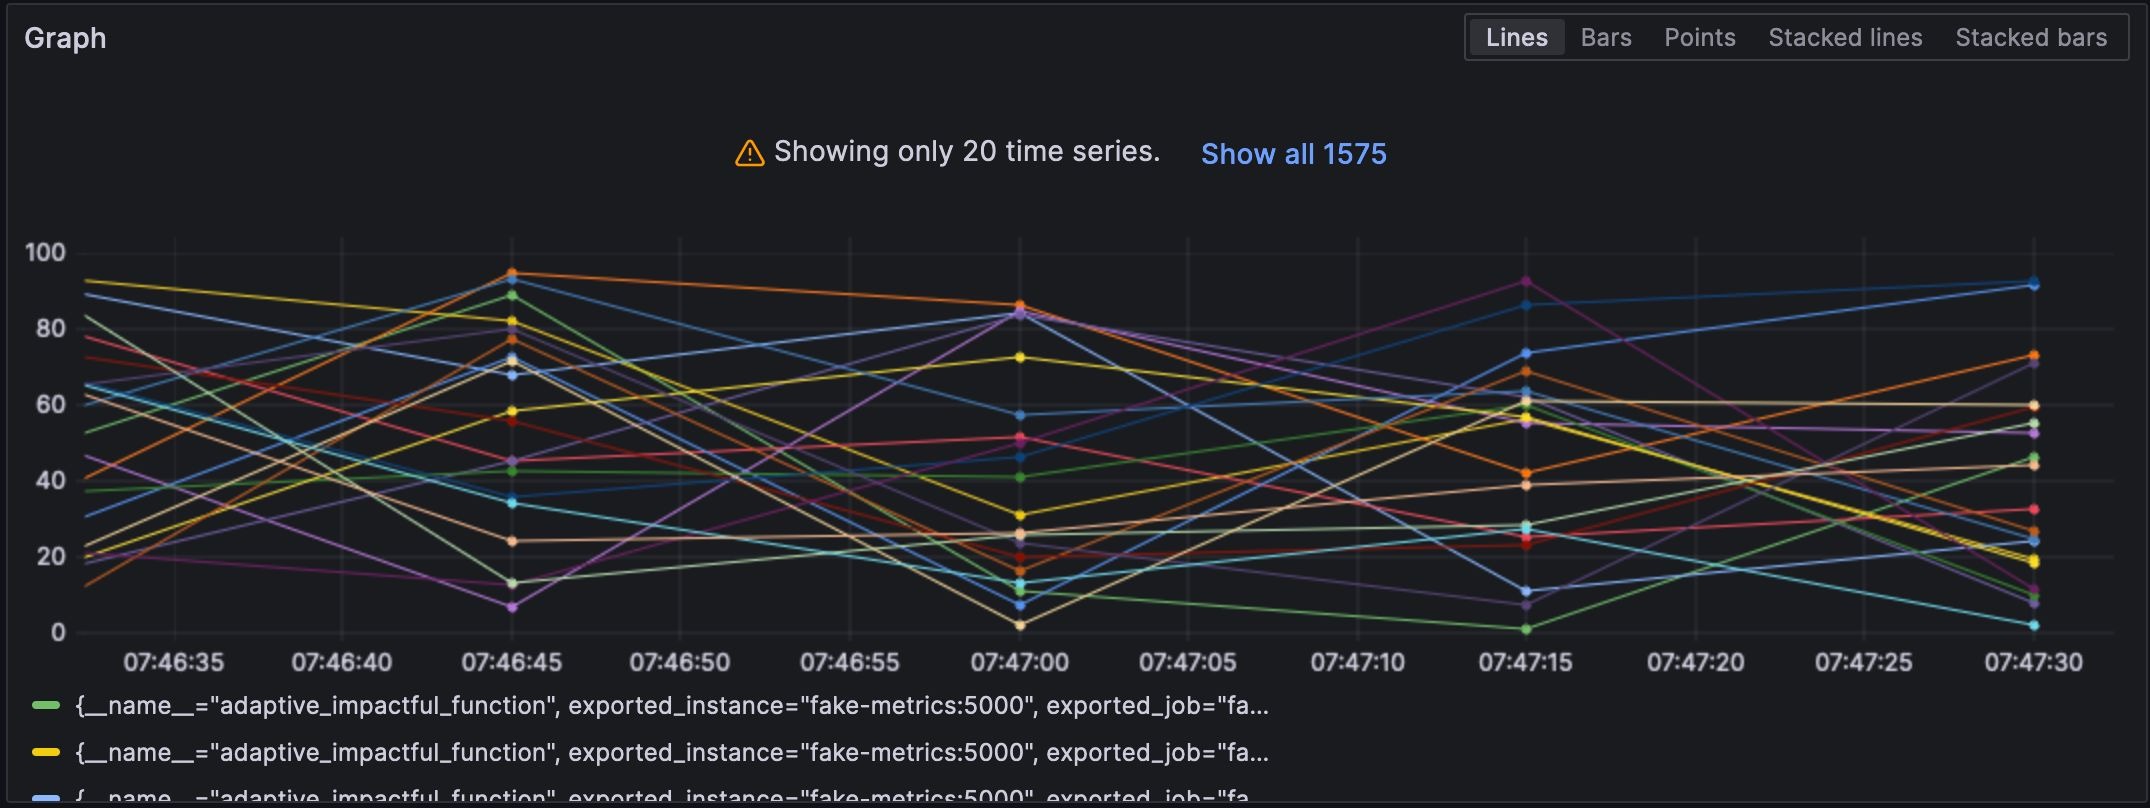
exporters: [ "prometheus" ]以下是結果:
連接接收器與匯出器
A connector is both a receiver and an exporter and connects two pipelines. The example from the documentation receives the number of spans (tracing) and exports the count, which has a metric. I tried to achieve the same with 500 errors — spoiler: it doesn’t work as intended.
首先,我們添加一個日誌接收器:
receivers:
  filelog:
    include: [ "/var/logs/generated.log" ]
接著,加入一個連接器:
connectors:
  count:
    requests.errors:
      description: Number of 500 errors
      condition: [ "status == 500 " ]
最後,將日誌接收器與指標匯出器連接起來:
service:
   pipelines:
     logs:
       receivers: [ "filelog" ]
       exporters: [ "count" ]
     metrics:
receivers: [ "prometheus", "count" ]該指標名為log_record_count_total,但其值始終為1。
日誌操作
處理器允許數據操作;操作員是專門處理日誌的處理器。若您熟悉ELK堆棧,它們相當於Logstash。
目前,日誌時間戳是攝入時間戳。我們將其更改為創建時間戳。
receivers:
  filelog:
    include: [ "/var/logs/generated.log" ]
    operators:
      - type: json_parser                                                   #1
        timestamp:                                                          #2
          parse_from: attributes.datetime                                   #3
          layout: "%d/%b/%Y:%H:%M:%S %z"                                    #4
        severity:                                                           #2
          parse_from: attributes.status                                     #3
          mapping:                                                          #5
            error: 5xx                                                      #6
            warn: 4xx
            info: 3xx
            debug: 2xx
      - id: remove_body                                                     #7
        type: remove
        field: body
      - id: remove_datetime                                                 #7
        type: remove
        field: attributes.datetime
      - id: remove_status                                                   #7
        type: remove
field: attributes.status- 日誌以JSON格式存儲;我們可以使用提供的JSON解析器
- 需設置的元數據屬性
- 要從中讀取的字段
- 解析模式
- 映射表
- 接受一個範圍,例如e.g.,
501-599。操作員對HTTP狀態碼有一個特殊解釋值5xx(及類似)。 - 移除重複數據
日誌
至此,我們可以將日誌發送到任何日誌聚合組件。我們將留在Grafana Labs領域並使用Loki。
exporters:
  loki:
    endpoint: "http://loki:3100/loki/api/v1/push"
我們還可以使用收集器本身的日誌:
service:
  telemetry:
    logs:
最後,讓我們添加另一個管道:
service:
  pipelines:
    logs:
      receivers: [ "filelog" ]
      exporters: [ "loki" ]
Grafana也能視覺化日誌。選擇Loki作為數據源。
結論
在這篇文章中,我們深入探討了OpenTelemetry收集器。雖然它並非OTEL架構的必備部分,但對於所有數據處理需求來說,它是一把實用的瑞士刀。如果你不拘泥於特定技術棧或不想受限,它將是極大的助力。
本文完整源碼可在GitHub上找到。
深入學習
Source:
https://dzone.com/articles/exploring-the-opentelemetry-collector