


When it comes to observability Grafana is the go-to tool for visualization. A Grafana dashboard consists of various forms of visualizations which are usually backed by a database.
This is not always the case. Sometimes instead of pushing the data from the database as is, you might want to refine the data. This cannot always be achieved through the functionalities the DB provides. For example, you might want to fetch results from a proprietary API. This is where the grafana-infinity-datasource plugin kicks in. With grafana-infinity-datasource, you can create visualizations based on JSON, XML, CSV, etc. You can issue an HTTP request to a REST API and plot the received data.
Tutorial
Let’s assume we have an eShop application. We will create a simple Python API using FastAPI to manage the items of the eShop and the purchase volume.
Through this API, we will add items and purchase-volume entries.
from fastapi import FastAPI, HTTPException
from pydantic import BaseModel
from typing import List
from datetime import datetime

app = FastAPI()

class Item(BaseModel):
    id: int
    name: str
    description: str = None
    price: float

class Purchase(BaseModel):
    price: float
    time: datetime

items = []
purchases = []

@app.post("/items/", response_model=Item)
def create_item(item: Item):
    items.append(item)
    return item

@app.get("/items/", response_model=List[Item])
def read_items():
    return items

@app.get("/items/{item_id}", response_model=Item)
def read_item(item_id: int):
    for item in items:
        if item.id == item_id:
            return item
    raise HTTPException(status_code=404, detail="Item not found")

@app.delete("/items/{item_id}", response_model=Item)
def delete_item(item_id: int):
    for idx, item in enumerate(items):
        if item.id == item_id:
            return items.pop(idx)
    raise HTTPException(status_code=404, detail="Item not found")

@app.post("/purchases/", response_model=Purchase)
def create_purchase(purchase: Purchase):
    purchases.append(purchase)
    return purchase

@app.get("/purchases/", response_model=List[Purchase])
def read_purchases():
    return purchases
We also need FastAPI to be added to the requirements.txt:
fastapiWe will host the application through Docker; thus, we will create a Dockerfile:
FROM python:3.11-slim

WORKDIR /app

COPY requirements.txt .

RUN pip install --no-cache-dir -r requirements.txt

COPY main.py main.py

EXPOSE 8000

CMD ["uvicorn", "main:app", "--host", "0.0.0.0", "--port", "8000"]
We should proceed to the Grafana visualizations. Essentially, we have two different sources of data.
The model Item will be visualized in a table and the model purchase will be visualized through a time series graph.
I shall use Docker Compose to provision Grafana as well as the Python application:
version: '3.8'

services:
  app:
    build: .
    ports:
      - 8000:8000
  grafana:
    image: grafana/grafana:latest
    ports:
      - "3000:3000"
    volumes:
      - ./grafana:/var/lib/grafana
    environment:
      - GF_SECURITY_ADMIN_USER=test
      - GF_SECURITY_ADMIN_PASSWORD=infinity
      - GF_INSTALL_PLUGINS=yesoreyeram-infinity-datasource
Essentially through the environment variable on Docker, I enable the the infinity-datasource plugin.
We can get our instances up and running by issuing the following:
docker compose upDocker Compose V2 is out there with many good features.
We can now populate the application with some data:
$ curl -X POST "http://127.0.0.1:8000/purchases/" -H "Content-Type: application/json" -d '{"time": "2024-07-15T12:40:56","price":2.5}'
$ curl -X POST "http://127.0.0.1:8000/purchases/" -H "Content-Type: application/json" -d '{"time": "2024-07-15T12:41:56","price":4.0}'
$ curl -X POST "http://127.0.0.1:8000/purchases/" -H "Content-Type: application/json" -d '{"time": "2024-07-15T12:42:56","price":1.5}'
$ curl -X POST "http://127.0.0.1:8000/purchases/" -H "Content-Type: application/json" -d '{"time": "2024-07-15T12:43:56","price":3.5}'

$ curl -X POST "http://127.0.0.1:8000/items/" -H "Content-Type: application/json" -d '{"id": 1, "name": "Item 1", "description": "This is item 1", "price": 10.5, "tax": 0.5}'
Moving onward, create a dashboard on Grafana.
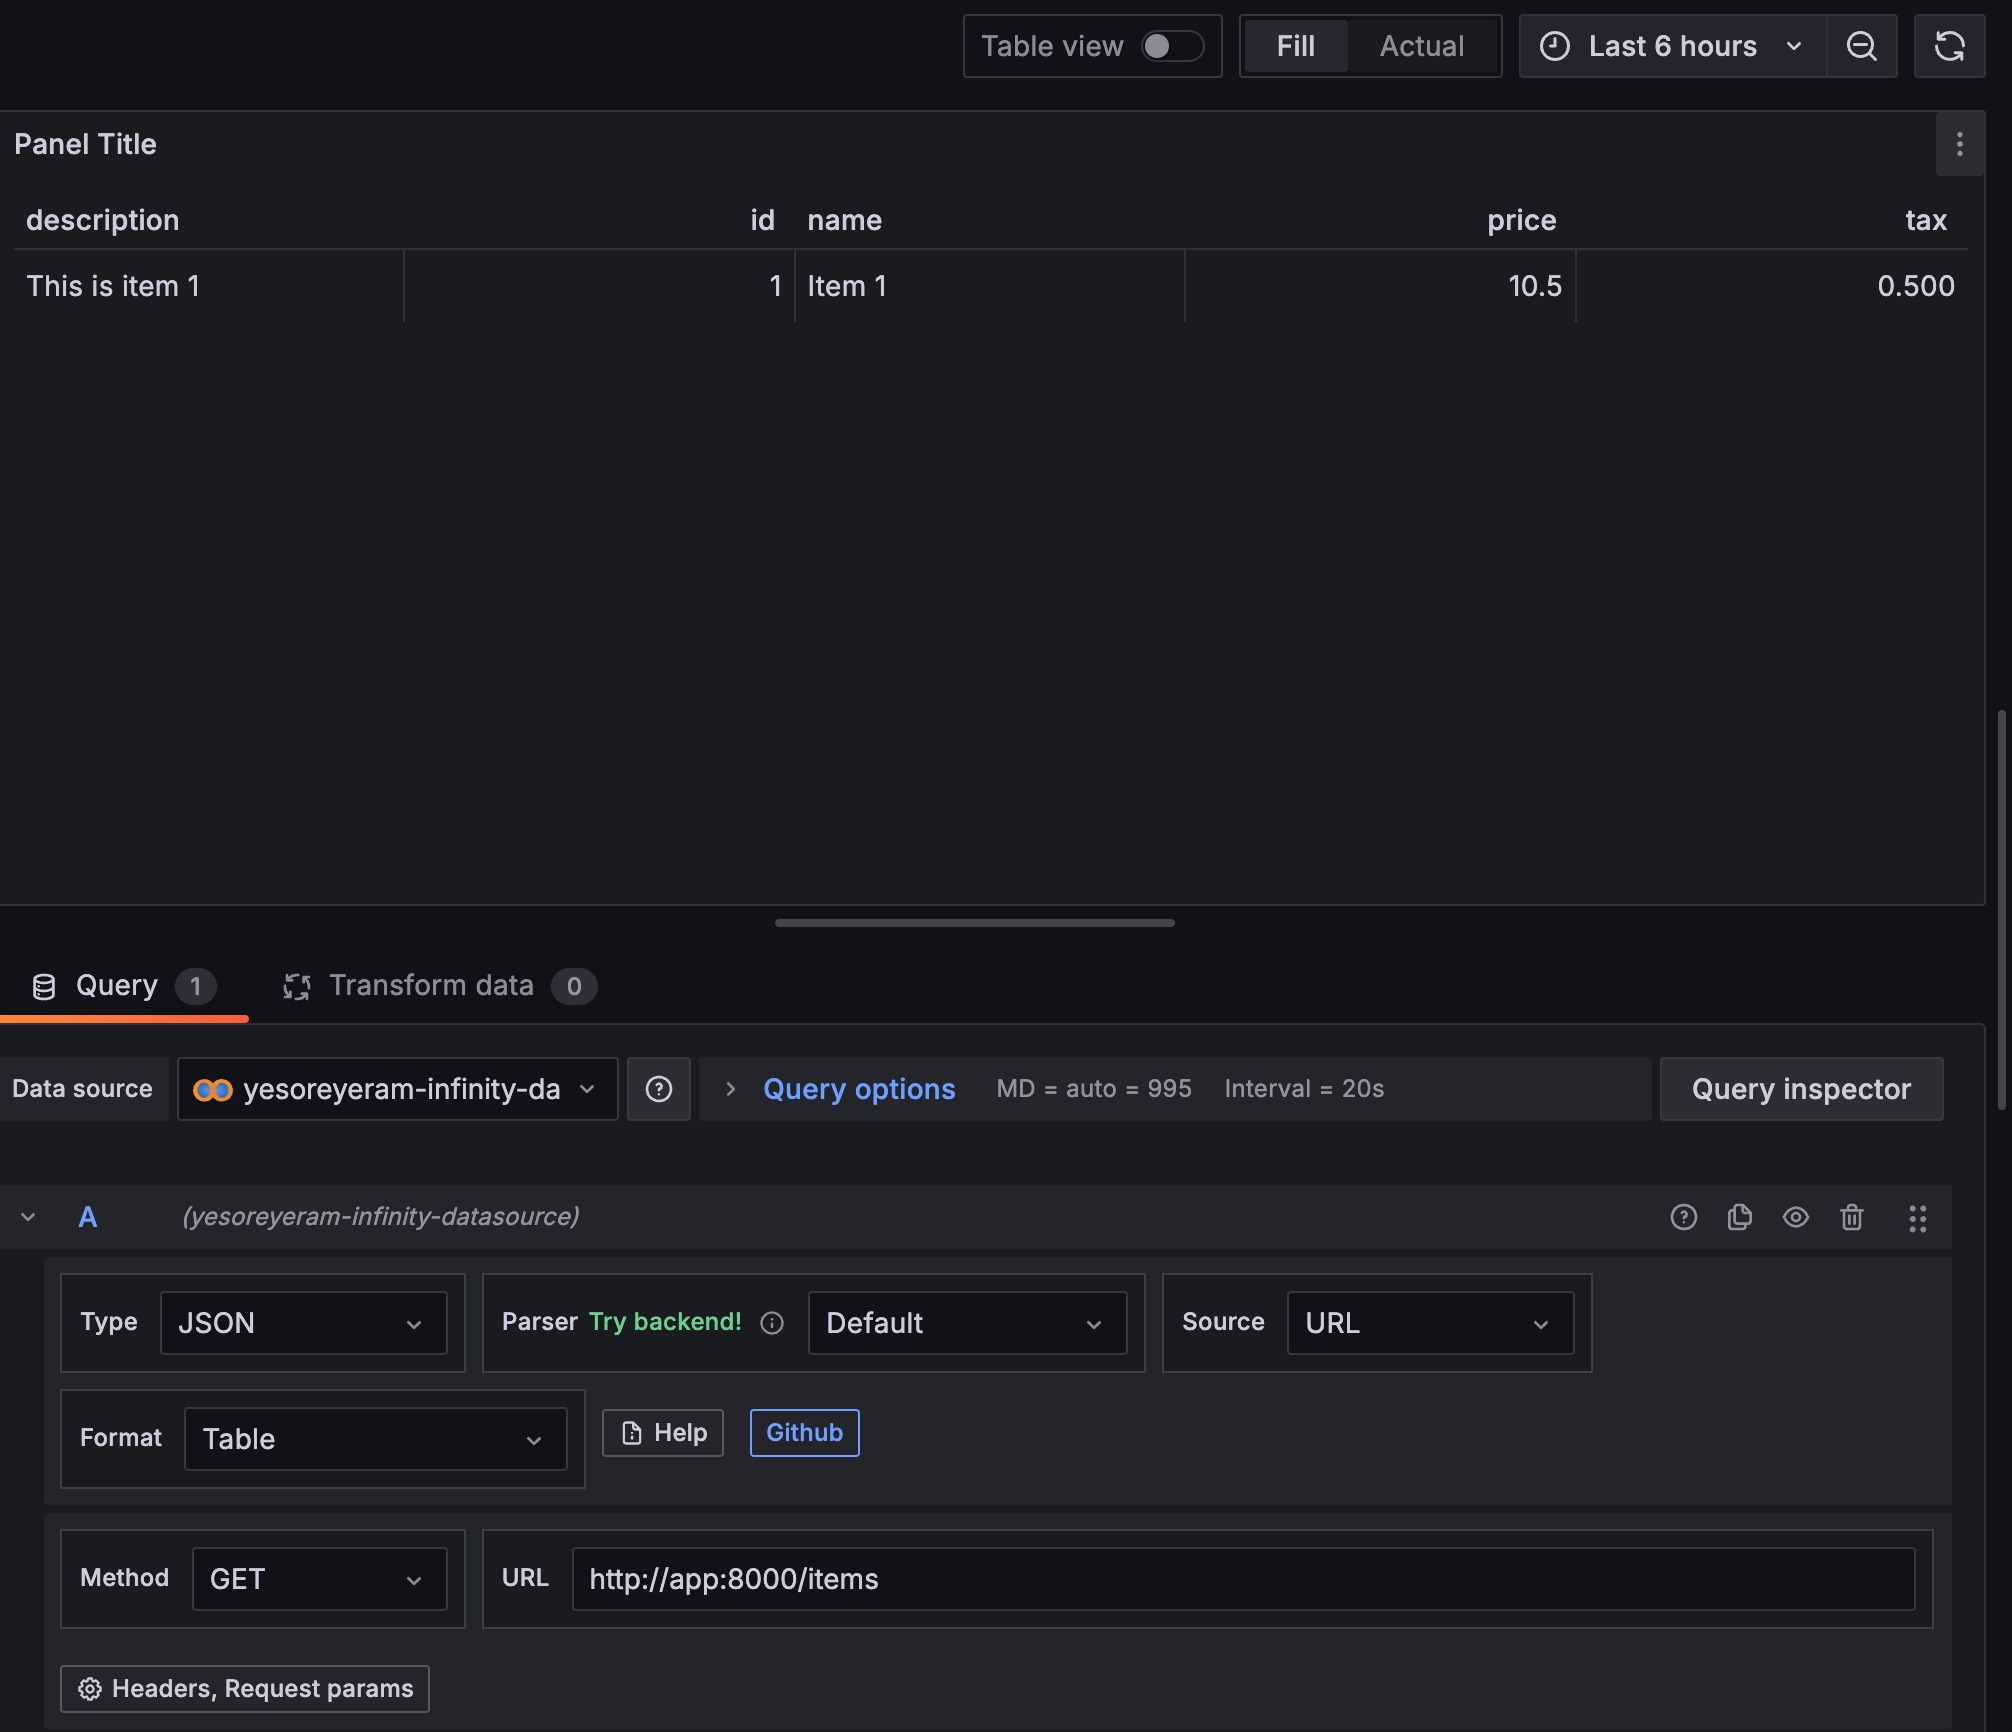
One visualization for items:
One visualization for purchase volume:
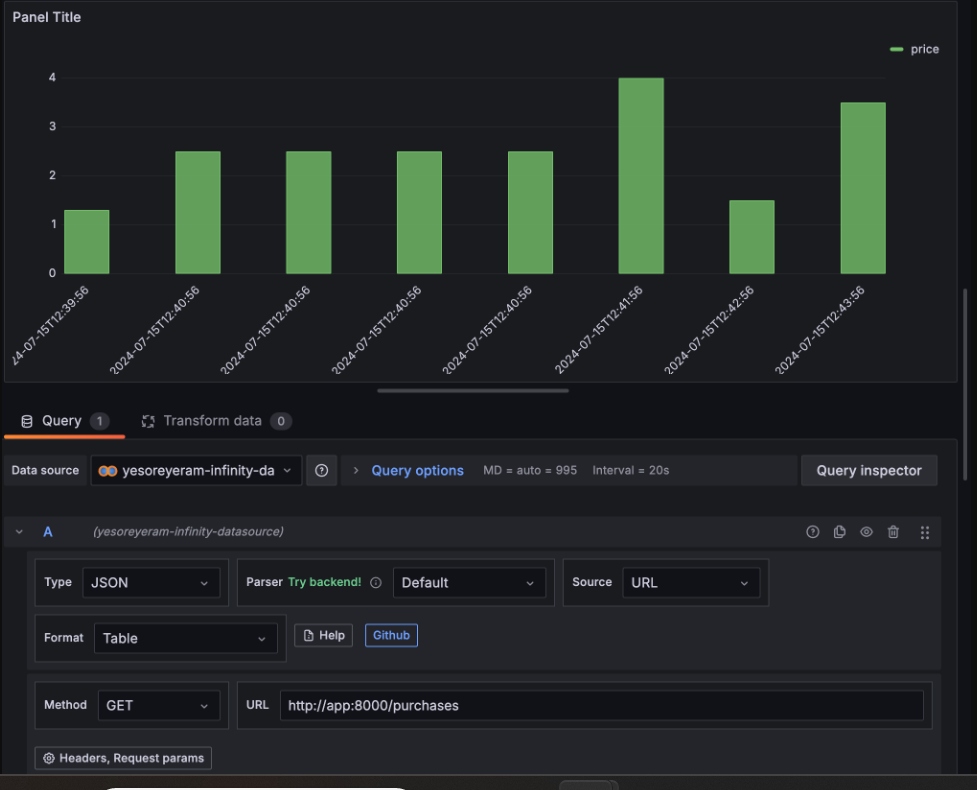
As you can see in both cases, I used the http://app:8000 endpoint which is our application, and the DNS that the Compose application can resolve.
That’s it! We plotted our data from a REST API using Grafana.
Source:
https://dzone.com/articles/plot-rest-endpoints-using-grafana-infinity-datasource