


OpenTelemetry Collector는 OpenTelemetry 아키텍처의 중심에 위치하지만 W3C Trace Context와는 무관합니다. 제 추적 데모에서는 Collector 대신 Jaeger를 사용합니다. 그러나 이는 매우 흔한 경우로, 모든 OpenTelemetry 관련 게시물에서 볼 수 있습니다. 저는 이를 더 자세히 살펴보고 싶었습니다.
이 게시물에서는 Collector의 다양한 측면을 탐색합니다:
- 데이터 종류: 로그, 메트릭, 트레이스
- 푸시 및 풀 모델
- 작업: 읽기, 변환, 쓰기
첫 단계
A long time ago, observability as we know it didn’t exist; what we had instead was monitoring. Back then, monitoring was a bunch of people looking at screens displaying dashboards. Dashboards themselves consisted of metrics and only system metrics, mainly CPU, memory, and disk usage. For this reason, we will start with metrics.
Prometheus는 주요 모니터링 솔루션 중 하나입니다. 이는 풀 기반 모델로 작동하며, Prometheus는 애플리케이션의 호환 가능한 엔드포인트를 스크랩하고 내부에 저장합니다.
우리는 OTEL Collector를 사용하여 Prometheus 호환 엔드포인트를 스크랩하고 콘솔에 결과를 출력할 것입니다. Grafana Labs는 랜덤 메트릭을 생성하여 사용할 수 있는 프로젝트를 제공합니다. 단순성을 위해 Docker Compose를 사용하겠습니다. 설정은 다음과 같습니다:
version: "3"

services:
  fake-metrics:
    build: ./fake-metrics-generator                                         #1
  collector:
    image: otel/opentelemetry-collector:0.87.0                              #2
    environment:                                                            #3
      - METRICS_HOST=fake-metrics
      - METRICS_PORT=5000
    volumes:
- ./config/collector/config.yml:/etc/otelcol/config.yaml:ro #4- 가짜 메트릭 프로젝트에 대한 Docker 이미지가 없으므로 이를 빌드해야 합니다
- 작성 당시 최신 버전의 OTEL Collector
- 다음 구성 파일을 매개변수화합니다
- 모든 일이 여기서 발생합니다
위에서 언급했듯이, OTEL Collector는 많은 기능을 수행할 수 있습니다. 따라서 구성이 전부입니다.
receivers:                                                                  #1
  prometheus:                                                               #2
    config:
      scrape_configs:                                                       #3
        - job_name: fake-metrics                                            #4
          scrape_interval: 3s
          static_configs:
            - targets: [ "${env.METRICS_HOST}:${env.METRICS_PORT}" ]

exporters:                                                                  #5
  logging:                                                                  #6
    loglevel: debug

service:
  pipelines:                                                                #7
    metrics:                                                                #8
      receivers: [ "prometheus" ]                                           #9
exporters: [ "logging" ] #10- 수신자 목록입니다. 수신자는 데이터를 읽습니다; 이는 푸시 기반 또는 풀 기반일 수 있습니다.
- 우리는
prometheus미리 정의된 수신자를 사용합니다 - 풀 작업 정의
- 작업의 구성
- 익스포터 목록입니다. 수신자와는 달리, 익스포터는 데이터를 작성합니다.
- 가장 간단한 익스포터는 표준 출력에 데이터를 작성하는 것입니다
- 파이프라인은 수신자와 익스포터를 조합합니다
- 메트릭 관련 파이프라인 정의
- 파이프라인은 이전에 정의된
prometheus수신자에서 데이터를 가져와logging익스포터로 보냅니다, 즉, 이를 인쇄합니다
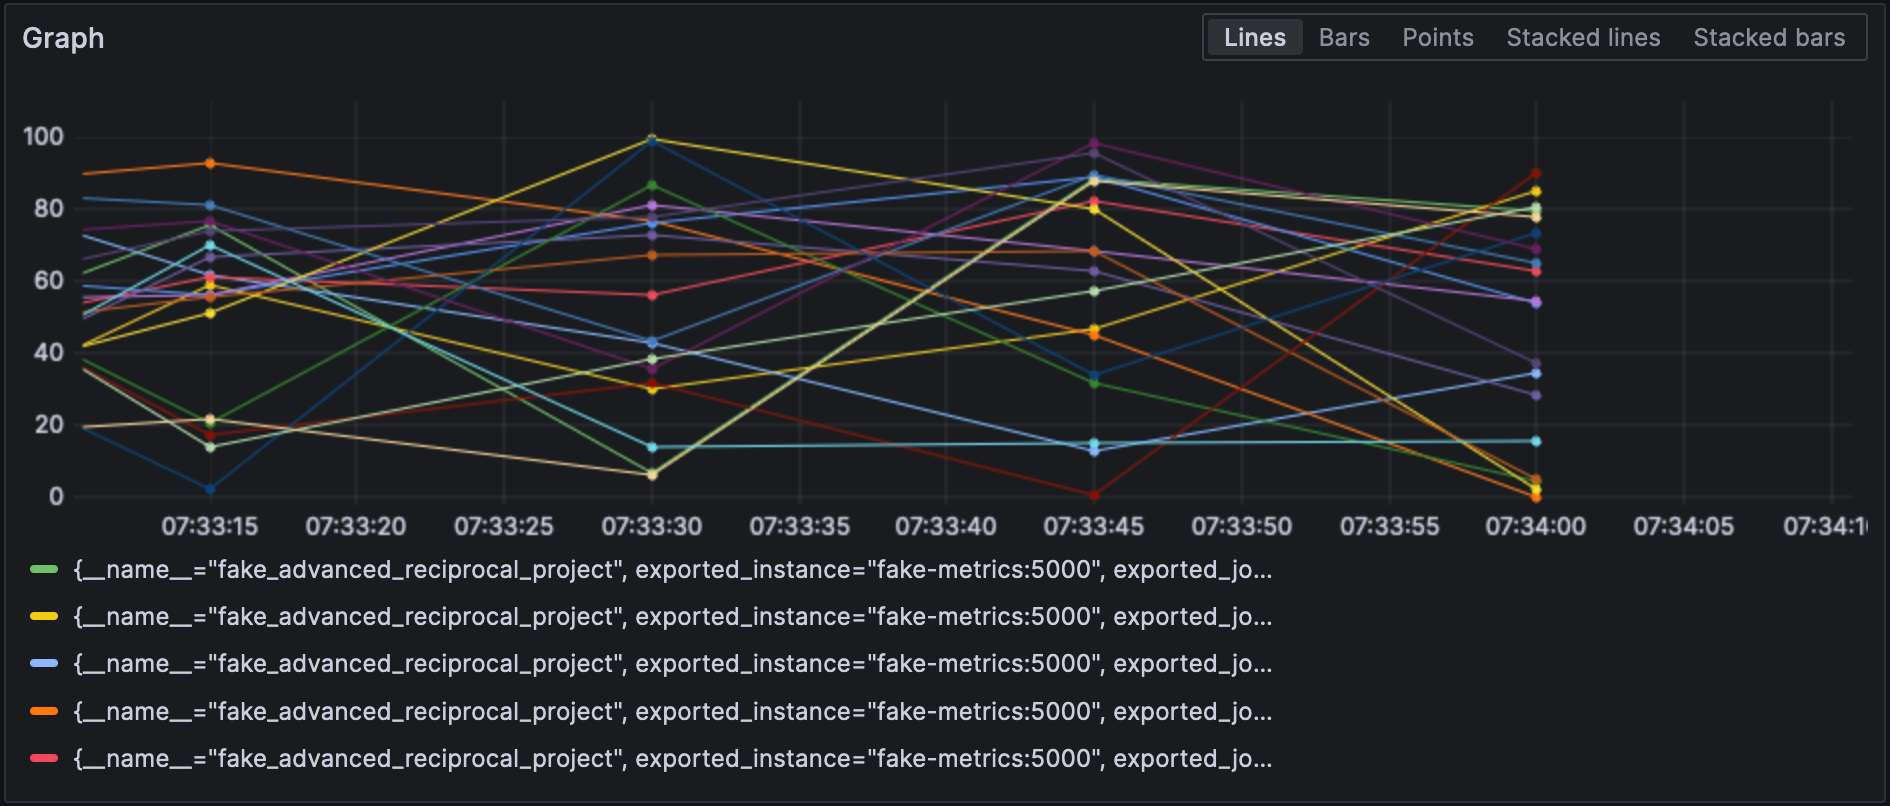
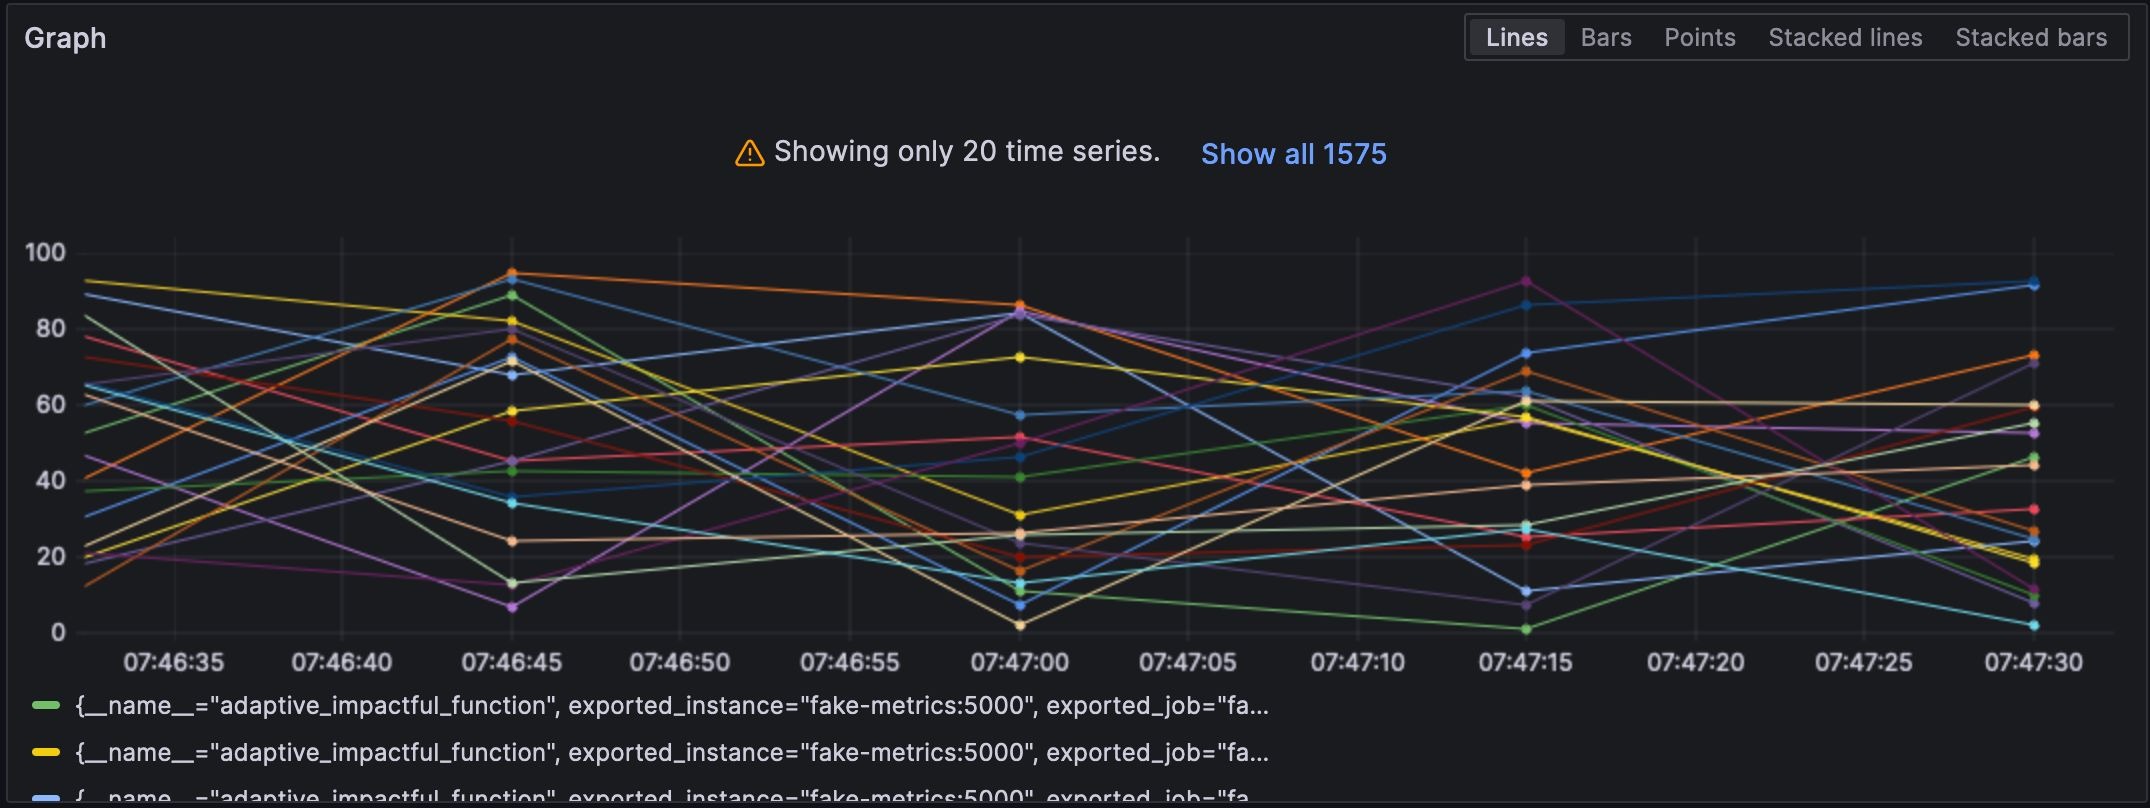
결과의 샘플입니다:
2023-11-11 08:28:54 otel-collector-collector-1     | StartTimestamp: 1970-01-01 00:00:00 +0000 UTC
2023-11-11 08:28:54 otel-collector-collector-1     | Timestamp: 2023-11-11 07:28:54.14 +0000 UTC
2023-11-11 08:28:54 otel-collector-collector-1     | Value: 83.090000
2023-11-11 08:28:54 otel-collector-collector-1     | NumberDataPoints #1
2023-11-11 08:28:54 otel-collector-collector-1     | Data point attributes:
2023-11-11 08:28:54 otel-collector-collector-1     |      -> fake__embrace_world_class_systems: Str(concept)
2023-11-11 08:28:54 otel-collector-collector-1     |      -> fake__exploit_magnetic_applications: Str(concept)
2023-11-11 08:28:54 otel-collector-collector-1     |      -> fake__facilitate_wireless_architectures: Str(extranet)
2023-11-11 08:28:54 otel-collector-collector-1     |      -> fake__grow_magnetic_communities: Str(challenge)
2023-11-11 08:28:54 otel-collector-collector-1     |      -> fake__reinvent_revolutionary_applications: Str(support)
2023-11-11 08:28:54 otel-collector-collector-1     |      -> fake__strategize_strategic_initiatives: Str(internet_solution)
2023-11-11 08:28:54 otel-collector-collector-1     |      -> fake__target_customized_eyeballs: Str(concept)
2023-11-11 08:28:54 otel-collector-collector-1     |      -> fake__transform_turn_key_technologies: Str(framework)
2023-11-11 08:28:54 otel-collector-collector-1     |      -> fake__whiteboard_innovative_partnerships: Str(matrices)
2023-11-11 08:28:54 otel-collector-collector-1     | StartTimestamp: 1970-01-01 00:00:00 +0000 UTC
2023-11-11 08:28:54 otel-collector-collector-1     | Timestamp: 2023-11-11 07:28:54.14 +0000 UTC
2023-11-11 08:28:54 otel-collector-collector-1     | Value: 53.090000
2023-11-11 08:28:54 otel-collector-collector-1     | NumberDataPoints #2
2023-11-11 08:28:54 otel-collector-collector-1     | Data point attributes:
2023-11-11 08:28:54 otel-collector-collector-1     |      -> fake__expedite_distributed_partnerships: Str(approach)
2023-11-11 08:28:54 otel-collector-collector-1     |      -> fake__facilitate_wireless_architectures: Str(graphical_user_interface)
2023-11-11 08:28:54 otel-collector-collector-1     |      -> fake__grow_magnetic_communities: Str(policy)
2023-11-11 08:28:54 otel-collector-collector-1     |      -> fake__reinvent_revolutionary_applications: Str(algorithm)
2023-11-11 08:28:54 otel-collector-collector-1     |      -> fake__transform_turn_key_technologies: Str(framework)
2023-11-11 08:28:54 otel-collector-collector-1     | StartTimestamp: 1970-01-01 00:00:00 +0000 UTC
2023-11-11 08:28:54 otel-collector-collector-1     | Timestamp: 2023-11-11 07:28:54.14 +0000 UTC
2023-11-11 08:28:54 otel-collector-collector-1     | Value: 16.440000
2023-11-11 08:28:54 otel-collector-collector-1     | NumberDataPoints #3
2023-11-11 08:28:54 otel-collector-collector-1     | Data point attributes:
2023-11-11 08:28:54 otel-collector-collector-1     |      -> fake__exploit_magnetic_applications: Str(concept)
2023-11-11 08:28:54 otel-collector-collector-1     |      -> fake__grow_magnetic_communities: Str(graphical_user_interface)
2023-11-11 08:28:54 otel-collector-collector-1     |      -> fake__target_customized_eyeballs: Str(extranet)
인쇄 외
위의 내용은 훌륭한 첫 단계이지만 콘솔에 인쇄하는 것 이상입니다. 우리는 메트릭을 일반적인 Prometheus 인스턴스에 의해 스크랩될 수 있도록 노출시킬 것입니다; 우리는 이를 시각화하기 위해 Grafana 대시보드를 추가할 수 있습니다. 무의미해 보일 수도 있지만, 이는 단지 계단 돌 뿐입니다.
위의 목표를 달성하기 위해, 우리는 OTEL Collector 구성만 변경합니다:
exporters:
  prometheus:                                                               #1
    endpoint: ":${env:PROMETHEUS_PORT}"                                     #2

service:
  pipelines:
    metrics:
      receivers: [ "prometheus" ]
exporters: [ "prometheus" ] #3- 익스포터로
prometheus추가 - Prometheus 호환 엔드포인트 노출
- 인쇄 대신 노출 교체
그게 다입니다. OTEL Collector는 매우 유연합니다.
Collector가 다중 입력, 다중 출력이라는 점에 유의하세요. 데이터를 인쇄하고 엔드포인트를 통해 노출하려면 이들을 파이프라인에 추가하면 됩니다:
exporters:
  prometheus:                                                               #1
    endpoint: ":${env:PROMETHEUS_PORT}"
  logging:                                                                  #2
    loglevel: debug

service:
  pipelines:
    metrics:
      receivers: [ "prometheus" ]
exporters: [ "prometheus", "logging" ] #3- 데이터 노출
- 데이터 인쇄
- 파이프라인은 데이터를 출력하고 노출시킬 것입니다
Prometheus 내보내기 설정을 하면 Grafana에서 메트릭을 시각화할 수 있습니다.
수신기와 내보내기는 유형을 지정해야 하며 그리고 각각은 고유해야 합니다. 마지막 요구 사항을 준수하기 위해 구별을 위해 한 가지 표현을 추가할 수 있습니다. 즉, prometheus/foo 및 prometheus/bar.
중간 데이터 처리
A valid question would be why the OTEL Collector is set between the source and Prometheus, as it makes the overall design more fragile. At this stage, we can leverage the true power of the OTEL Collector: data processing. So far, we have ingested raw metrics, but the source format may not be adapted to how we want to visualize data. For example, in our setup, metrics come from our fake generator, “business,” and the underlying NodeJS platform, “technical.” It is reflected in the metrics’ name. We could add a dedicated source label and remove the unnecessary prefix to filter more efficiently.
데이터 처리기를 구성 파일의 processors 섹션에 선언합니다. 컬렉터는 선언된 순서대로 실행합니다. 위의 변환을 구현해 보겠습니다.
목표를 달성하기 위한 첫 번째 단계는 컬렉터가 두 가지 형태인 것을 이해하는 것입니다: “베어” 한 가지와 그 위에 구축된 contrib 한 가지입니다. 전자에 포함된 처리기는 수와 기능 모두 제한되어 있으므로 contrib 버전으로 전환해야 합니다.
collector:
  image: otel/opentelemetry-collector-contrib:0.87.0                        #1
  environment:
    - METRICS_HOST=fake-metrics
    - METRICS_PORT=5000
    - PROMETHEUS_PORT=8889
  volumes:
- ./config/collector/config.yml:/etc/otelcol-contrib/config.yaml:ro #2contrib맛 사용- 더욱 재미있는 것은 구성 파일이 다른 경로에 있다는 것입니다
이 시점에서 처리기 자체를 추가할 수 있습니다.
processors:
  metricstransform:                                                         #1
    transforms:                                                             #2
      - include: ^fake_(.*)$                                                #3
        match_type: regexp                                                  #3
        action: update
        operations:                                                         #4
          - action: add_label                                               #5
            new_label: origin
            new_value: fake
      - include: ^fake_(.*)$
        match_type: regexp
        action: update                                                      #6
        new_name: $${1}                                                     #6-7
# NodeJS에 의해 생성된 메트릭으로 동일한 작업을 수행- 메트릭 변환 처리기 호출
- 순서대로 적용된 변환 목록
- 정의된 정규식과 일치하는 모든 메트릭
- 순서대로 적용된 작업 목록
- 레이블 추가
- 정규식 그룹 접두사를 제거하여 메트릭 이름 변경
- 재미있는 것: 구문은
$${x}입니다.
마지막으로 정의된 처리기를 파이프라인에 추가합니다:
service:
  pipelines:
    metrics:
      receivers: [ "prometheus" ]
      processors: [ "metricstransform" ]
      exporters: [ "prometheus" ]
결과는 다음과 같습니다:
수신기 및 수출기 연결
A connector is both a receiver and an exporter and connects two pipelines. The example from the documentation receives the number of spans (tracing) and exports the count, which has a metric. I tried to achieve the same with 500 errors — spoiler: it doesn’t work as intended.
먼저 로그 수신기를 추가합시다:
receivers:
  filelog:
    include: [ "/var/logs/generated.log" ]
그런 다음, 커넥터를 추가합니다:
connectors:
  count:
    requests.errors:
      description: Number of 500 errors
      condition: [ "status == 500 " ]
마지막으로, 로그 수신기와 메트릭스 수출기를 연결합니다:
service:
   pipelines:
     logs:
       receivers: [ "filelog" ]
       exporters: [ "count" ]
     metrics:
       receivers: [ "prometheus", "count" ]
메트릭의 이름은 log_record_count_total이지만, 그 값은 1로 유지됩니다.
로그 조작
프로세서는 데이터 조작을 허용합니다; 연산자는 로그에 작동하는 특수한 프로세서입니다. ELK 스택에 익숙하다면, 그들은 Logstash와 동등합니다.
현재로서는 로그 타임스탬프가 수집 타임스탬프입니다. 이를 생성 타임스탬프로 변경하겠습니다.
receivers:
  filelog:
    include: [ "/var/logs/generated.log" ]
    operators:
      - type: json_parser                                                   #1
        timestamp:                                                          #2
          parse_from: attributes.datetime                                   #3
          layout: "%d/%b/%Y:%H:%M:%S %z"                                    #4
        severity:                                                           #2
          parse_from: attributes.status                                     #3
          mapping:                                                          #5
            error: 5xx                                                      #6
            warn: 4xx
            info: 3xx
            debug: 2xx
      - id: remove_body                                                     #7
        type: remove
        field: body
      - id: remove_datetime                                                 #7
        type: remove
        field: attributes.datetime
      - id: remove_status                                                   #7
        type: remove
field: attributes.status- 로그는 JSON 형식입니다; 제공된 JSON 파서를 사용할 수 있습니다
- 설정할 메타데이터 속성
- 읽어올 필드
- 파싱 패턴
- 매핑 테이블
- 범위를 수락합니다, 예를 들어,
501-599입니다. 연산자는 HTTP 상태에 대한 특별한 해석된 값5xx(및 유사한)를 가지고 있습니다. - 중복된 데이터 제거
로그
이 시점에서 로그를 어떤 로그 집계 구성 요소로 보낼 수 있습니다. 우리는 Grafana Labs 영역에 머무르고 Loki를 사용하겠습니다.
exporters:
  loki:
    endpoint: "http://loki:3100/loki/api/v1/push"
컬렉터 자체에서 로그를 사용할 수도 있습니다:
service:
  telemetry:
    logs:
마지막으로, 다른 파이프라인을 추가하겠습니다:
service:
  pipelines:
    logs:
      receivers: [ "filelog" ]
      exporters: [ "loki" ]
Grafana는 로그를 시각화할 수도 있습니다. 데이터 소스로 Loki를 선택하세요.
결론
이번 포스트에서는 OpenTelemetry 컬렉터에 대해 자세히 살펴보았습니다. OTEL 아키텍처의 필수 구성 요소는 아니지만, 데이터 처리 요구 사항에 대한 유용한 스위스 군도입니다. 특정 스택에 얽매이지 않거나 원하지 않는 경우, 엄청난 도움이 됩니다.
이 포스트의 전체 소스 코드는 GitHub에서 확인할 수 있습니다.
더 깊이 들어가기
Source:
https://dzone.com/articles/exploring-the-opentelemetry-collector