Using IT monitoring in an organization’s infrastructure can improve its reliability and help prevent serious issues, failures, and downtimes. There are different approaches to implementing IT monitoring, by either using dedicated tools or native functionality. With either approach, you can view the monitoring data when needed or configure automatic alerts and reports to be notified of important events. This blog post explains how to enhance the IT monitoring strategy by using alarms and reports.
The Importance of IT Monitoring and Reporting for Businesses
IT monitoring is crucial for organizations because it helps ensure that the IT infrastructure is working properly and reliably.
- Maximizing uptime and reliability. Critical business systems usually require 24/7 operation. Such systems are used in industries like healthcare, finance, and other service providers where downtime can lead to serious consequences. Luckily, it is possible to prevent such issues if you implement and properly configure an IT monitoring system.
Proactive problem detection helps administrators discover potential issues such as server overloads, application errors, hardware issues, and performance degradation in time before they lead to major failures. This proactive approach allows administrators to interact and perform corrective actions before having a negative impact on servers, virtual machines (VMs), business operations and end users. Receiving reports indicating potential issues makes IT monitoring and administration more efficient.
- Enhancing security. IT monitoring is used to detect unauthorized access attempts, unusual network traffic and other suspicious activities that can be an indicator of a cyberattack. This approach allows administrators to detect security threats in time. Some industries must comply with regulatory requirements that require continuous monitoring of IT systems to avoid penalties.
- Improving performance and efficiency. Administrators can optimize resource usage on servers, virtual machines, and network equipment by configuring IT monitoring and alerts. Configuring IT monitoring tools to track CPU, memory, and bandwidth usage for further analysis of this data allows you to better understand what to improve. As a result, organizations can optimize their resources and reduce waste to achieve high efficiency in their IT systems. This also helps administrators to identify bottlenecks and enhance performance.
- Improving business continuity and disaster recovery. Early detection of failures is one of the main reasons why administrators of organizations should configure IT monitoring systems with notifications. This approach can detect signs of data corruption, application crashes, and hardware failures early to prevent data loss. Preventing data loss is necessary to maintain business continuity. By using monitoring tools with configured notifications, administrators can ensure that backup systems and disaster recovery plans are tested and are functioning correctly. It can be an assurance that a business can recover data and workloads quickly in case of a disaster.
- Improving customer experience. Customers expect services to be available at any time. Configuring IT monitoring systems to monitor servers, VMs, network equipment and applications related to the website operation helps ensure that the websites and services are always available for clients. Not only resource availability but performance is also monitored to achieve the best service.
Receiving reports that include information about issues can lead to quick resolution. The reports include the information needed by administrators to resolve issues as soon as possible. These actions minimize the negative impact on customers and, as a result, customers have a positive experience.
- Cost management. Configuring proactive monitoring can prevent downtime. Unplanned downtime can be costly because an organization loses revenue and has to spend resources to recover data and the infrastructure. Monitoring with alert notifications allows administrators to fix the issue as fast as they can and reduce the risk of downtime.
Understanding Alarms in IT Monitoring
Configuring alarms for IT monitoring systems improves the reaction time for administrators to be aware of the issue and fix it faster. If only resources like web pages with graphs and statistics are configured, then the system administrator can notice issues only when checking the web page with the monitoring information. Administrators have a wide set of different tasks and cannot usually continuously monitor a web page with the IT infrastructure state.
When alarms are configured, administrators receive a notification message about the issue, potential issue, failure, or other critical or suspicious events as soon as possible. A time interval can usually be configured, for example, a message can be sent in 1 minute or in 5 minutes after an issue was detected by the monitoring system.
As a result, the system administrator can notice the issue faster and react to fix the problem and avoid the negative consequences. Different notification methods can be used, such as notifications via email, SMS, Skype, etc., depending on the IT monitoring software.
What are alarms, and why do they matter?
Alarms are notifications that are triggered when a specific event occurs and the appropriate conditions or thresholds are met in the IT system. These conditions can be based on different events, including:
- Performance issues: High CPU usage, memory exhaustion, slow response times
- Resource thresholds: Disk space running low, network bandwidth saturation
- System failures: Server crashes, application errors, service outages
- Security incidents: Unauthorized access attempts, malware detection, unusual network traffic
- Operational events: Backup failures, service restarts, changes in configuration
When an alarm is triggered, the monitoring system generates an alert, and this alert is sent to the relevant user, primarily the IT administrator, through various channels. These alerts contain information about the issue, including its severity, the affected system or component, and recommended actions.
Key metrics to monitor
CPU utilization. Monitoring CPU usage is needed to ensure that there are enough resources for servers and systems in terms of processing power. This is important to handle workloads without being overloaded. H CPU usage can be a signal that the system is overloaded. Low CPU usage indicates that there are enough resources or that CPU resources are underutilized.
Memory (RAM) usage. Applications and services need enough memory for smooth operation, and the memory parameter is critical in this context. Administrators should monitor RAM usage to prevent memory bottlenecks, which can cause performance degradation and even system crashes. Keep an eye on excessive memory usage, insufficient memory allocation, and memory leaks.
Disk usage and I/O performance. Disk space and input/output (I/O) performance are critical metrics for data storage. It is recommended that you monitor these parameters to prevent storage-related issues, including performance issues. Pay attention to high disk usage, rapid growth of used disk space, high latency when reading/writing data, and frequent I/O wait times. Abnormal behavior regarding these parameters can indicate potential storage problems.
Network bandwidth and latency. Network performance affects all operations in an office or datacenter because computers, servers, and virtual machines are connected to each other via the network. Network performance is critical for services provided to customers. Monitoring network bandwidth and latency allows you to detect bottlenecks and other issues and fix them in time to use the network resources efficiently. Watch for high network utilization, packet loss, and high latency because these indicators are signs of slow performance and network connectivity issues.
Service and process availability. Important processes run in operating systems on servers or virtual machines, and they must be available to meet business needs. Monitoring services and their availability ensures that critical services are in up and running. To ensure service availability, administrators should monitor uptime, service restart frequencies, and process failures.
Database performance. Databases often are a part of more complex solutions, including web applications. Moreover, most software solutions for internal usage in organizations require databases. For these reasons, it is important to monitor the database performance and availability. Monitoring databases ensures that data is accessible and related operations run smoothly. When monitoring a database, focus on query response times, slow-running queries, database locks, and connection pool usage, as these metrics are vital for database health.
Reporting for IT Monitoring
Reporting is used to provide structured, actionable insights from the vast amount of data collected by monitoring tools. Reporting transforms raw data into information that can be readable and understandable for people working in an organization and mainly for IT administrators. After checking the reports, administrators, and management can make informed decisions. This allows the IT teams to optimize performance, prevent issues, and improve business continuity.
Reports can highlight anomalies that are not noticeable when researching the alarms. Data in reports is aggregated for more convenience to avoid the need to manually search for key metrics and organize the collected data. As a result, administrators have a high-level overview of the entire infrastructure and the most important components. Being informed about the conditions leading up to an incident can be used by administrators for fast incident response and performing preventive measures.
Monitoring with NAKIVO Backup & Replication
NAKIVO Backup & Replication can help you monitor the elements of your IT infrastructure. Go to the Monitoring section in the web interface, add the monitored items, and check the graphs displaying the supported metrics of the VMware vSphere infrastructure.
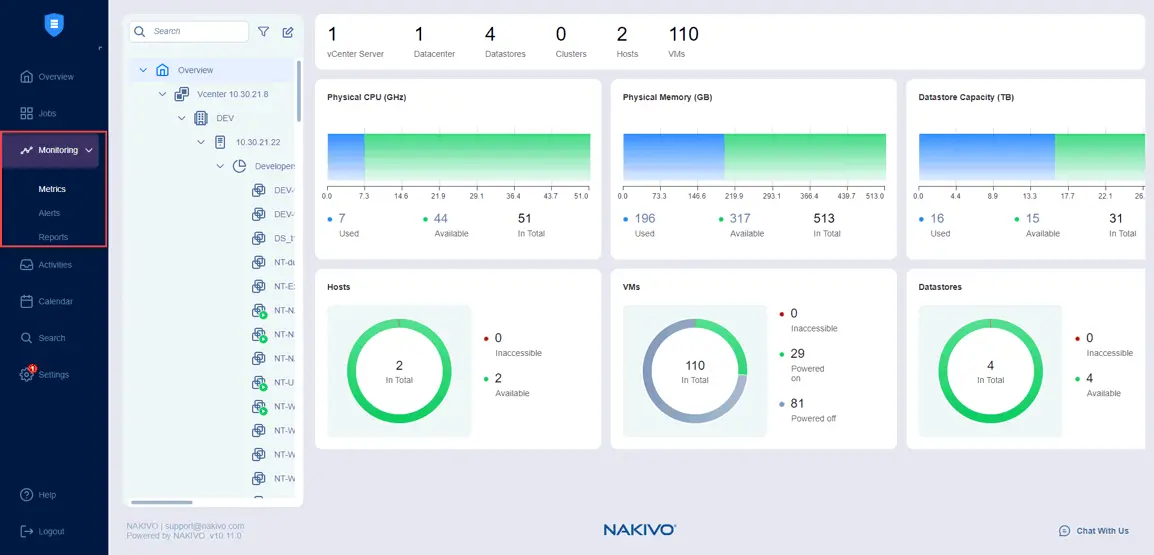
You can select items to monitor, such as ESXi hosts or clusters, VMware VMs, and datastores in Monitoring > Metrics.
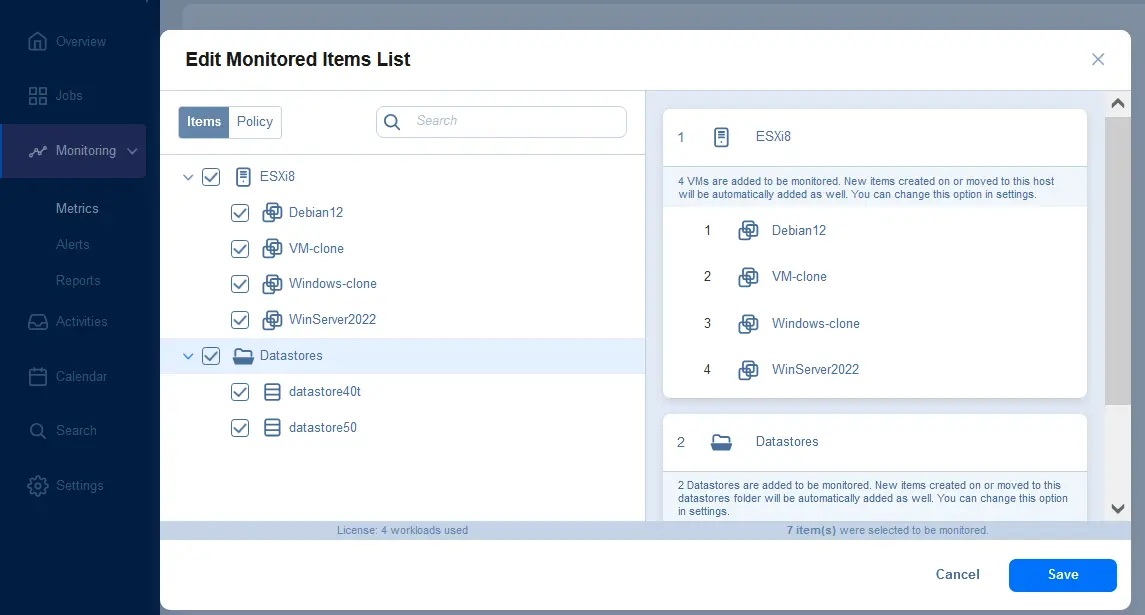
Configuring alarms in the NAKIVO solution
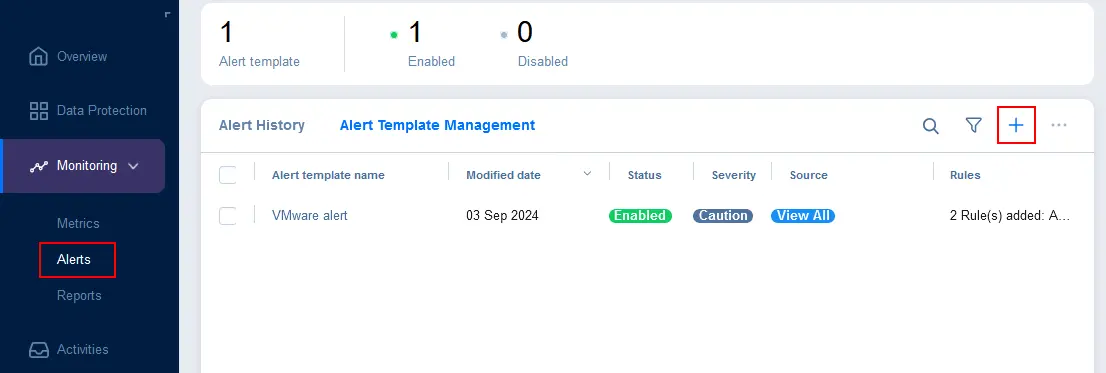
You can configure alerts in the NAKIVO solution to get notified about potential issues as soon as possible, allowing you to address them swiftly before they lead to any serious consequences.
- Go to Monitoring > Alerts, select the Alert Template Management tab, and click + to add alerts for specific items.
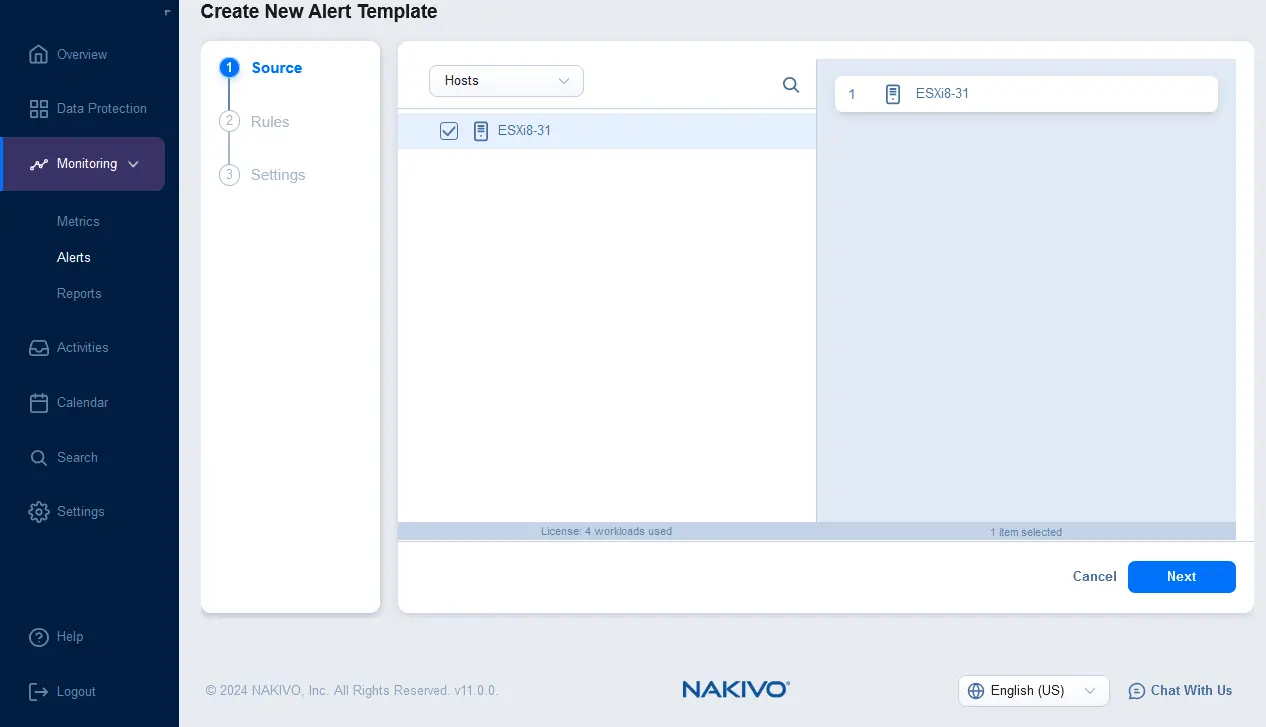
- Select the monitored items for which the alert should be triggered. You can select ESXi hosts, virtual machines (VMs) or datastores. Hit Next to continue.
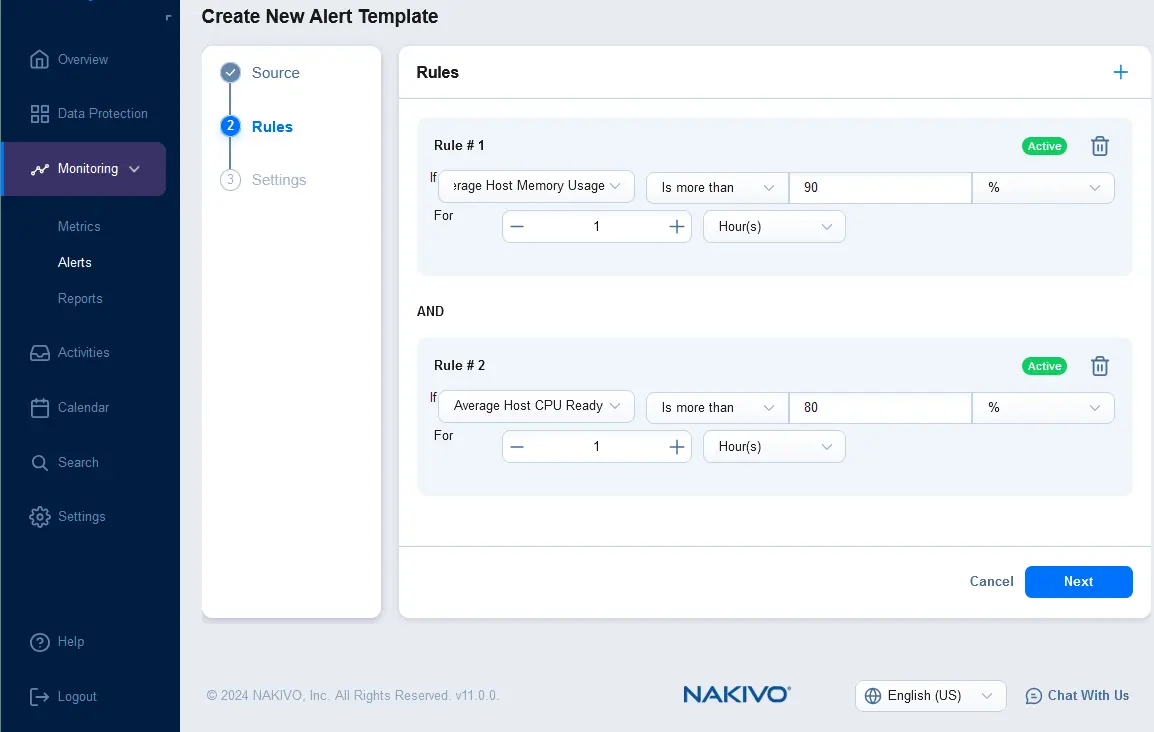
- Configure rules for a new alert template. Click + and select the rule condition. For example, you can set an alert rule template that must be triggered if the average host memory usage is more than 90% for 1 hour. You can add multiple rules for one alert template.
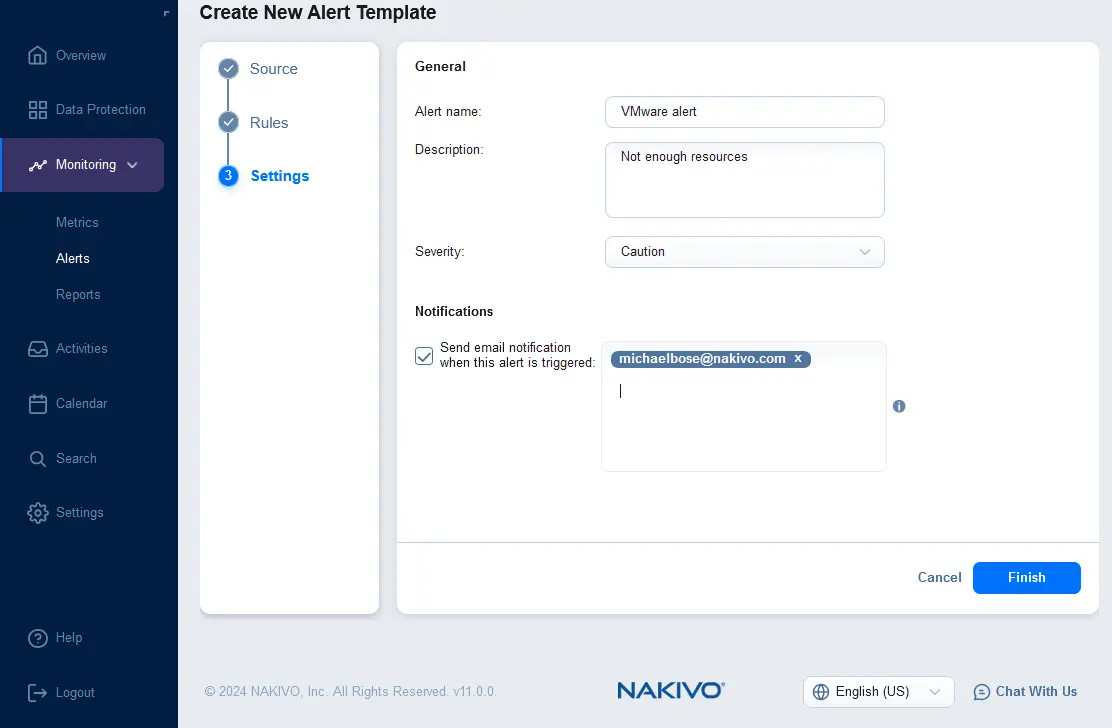
- Configure settings for the alert template. Enter the alert name and description, and select the severity. You can select the checkbox to send an email notification when this alert is triggered and enter multiple email addresses of the recipients who should receive the alert notifications. Click Finish.
Configuring reports in the NAKIVO solution
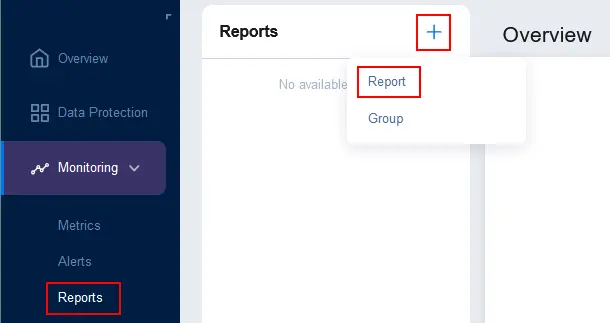
- To configure reports, go to Monitoring > Reports, click + and hit Report.
- You can select one of the supported source types:
- Infrastructure Overview – information about vCenter servers, ESXi hosts managed by vCenter and standalone ESXi hosts
- VM Performance
- Datastore Capacity
- Host Performance
- Protection Report
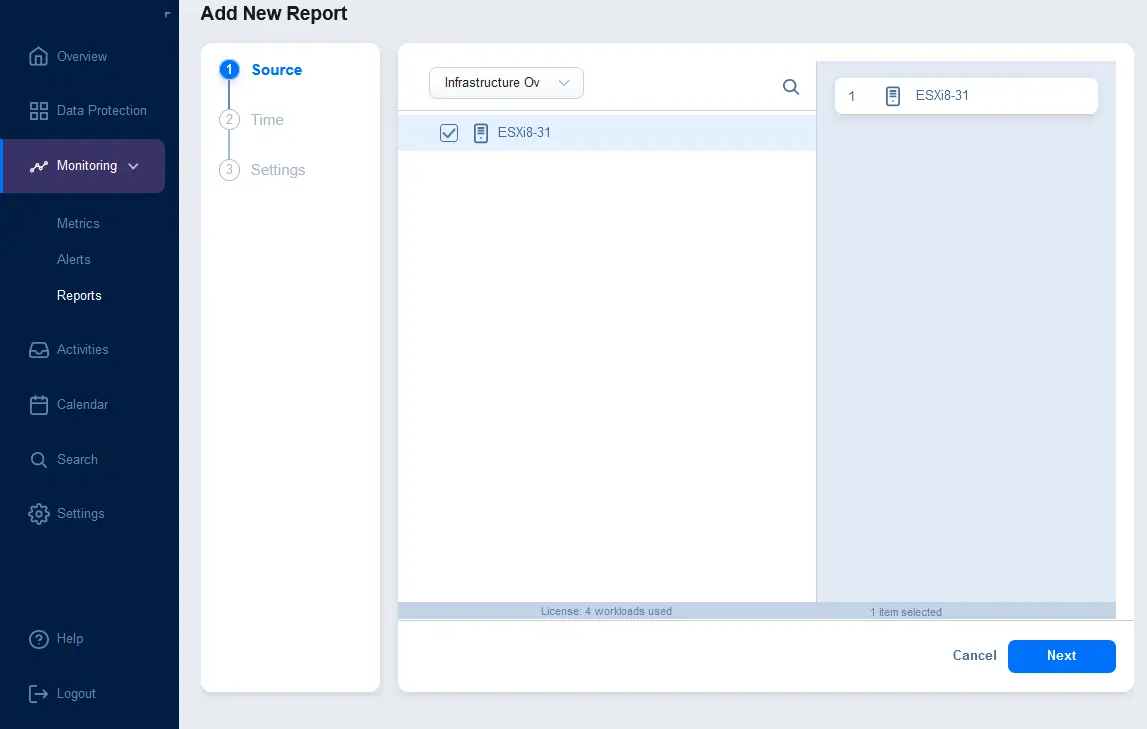
Once the source type is selected, select the items to include in the report. In the screenshot below, you can see that Infrastructure Overview is selected in the drop-down list and an ESXi host is selected to be included in the report. Click Next to continue.
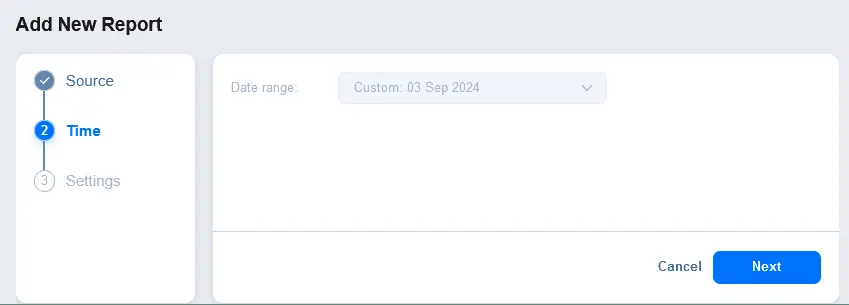
- Configure the time and date ranges for the report. For example, you can create a report for the last 30 days.
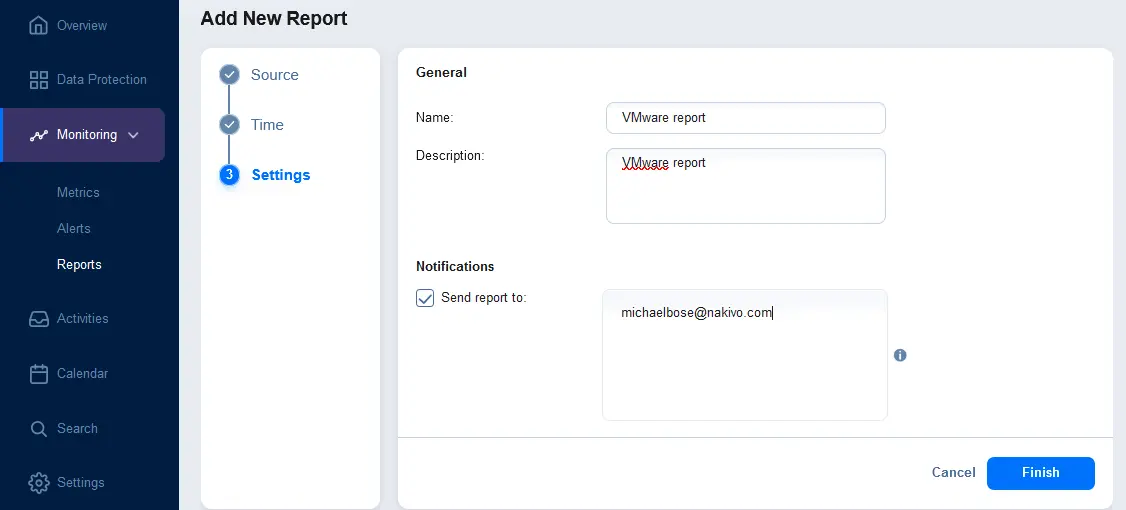
- Configure report settings. Enter a displayed report name and description. Optionally, in the Notifications section, select the checkbox to send a report to the specified email addresses. Enter an email address and press Enter to apply this email address. You can enter multiple email addresses. Hit Finish to save settings for report creation.
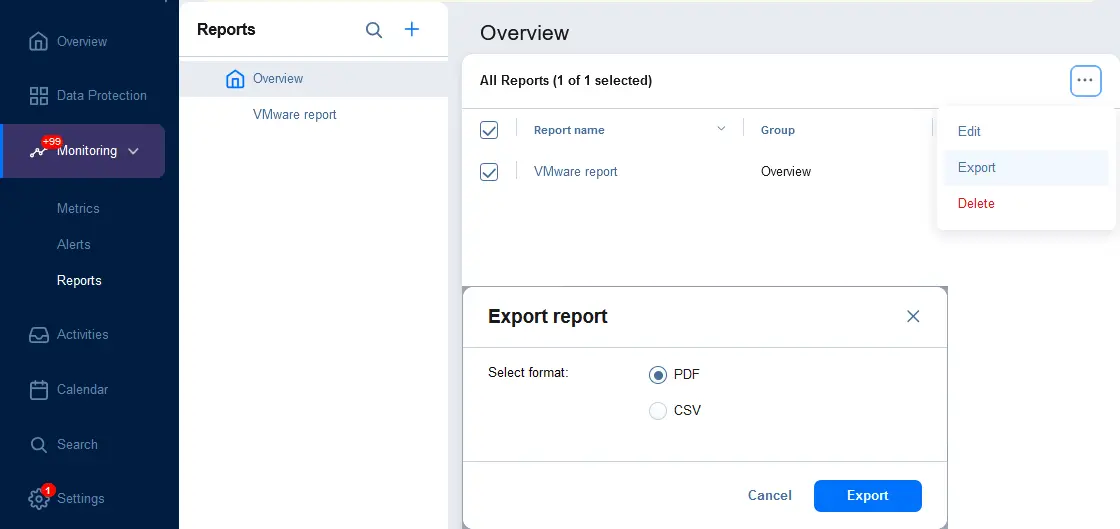
- You can export reports to a file. Go to Monitoring > Reports and select the reports you want to export (select checkboxes). Click the … (more options) button, click Export, and in the dialog box, select the file format (PDF or CSV). Hit Export.
Conclusion
Monitoring IT infrastructures can improve administration efficiency, ensure business continuity, and save costs. It is recommended that you configure IT monitoring tools to send alerts and reports for early incident response to prevent potential issues and fix existing issues as soon as possible. Use NAKIVO Backup & Replication to protect your data, including VMware virtual machines, as well as monitor your vSphere infrastructure and data protection jobs.
Source:
https://www.nakivo.com/blog/how-to-use-alarms-and-reporting-for-it-monitoring/


